
You're at the kitchen table with two browser tabs open. One is a $5-a-month subscription that renews automatically. The other is a $60 one-time license that asks for your card once and never again. Both do roughly the same job, and the cheaper number looks obvious until you ask the obvious follow-up: cheaper over what?
Twelve months of that subscription costs $60. The two options are identical at the first anniversary, and from month thirteen one of them keeps charging while the other has already been paid for. The price tag described one payment. The decision describes a period of use.
Cost and revenue only make sense together, and both reach further than the receipt in your inbox. What follows builds the relationship one step at a time: the three numbers behind any business, how costs behave as sales rise, how billing models shape revenue, and how to find the point where the two sides meet. Then it goes where price tags don't, into the hidden costs of time, switching, lock-in and risk that decide more outcomes than the sticker ever does.
Cost and Revenue at a Glance
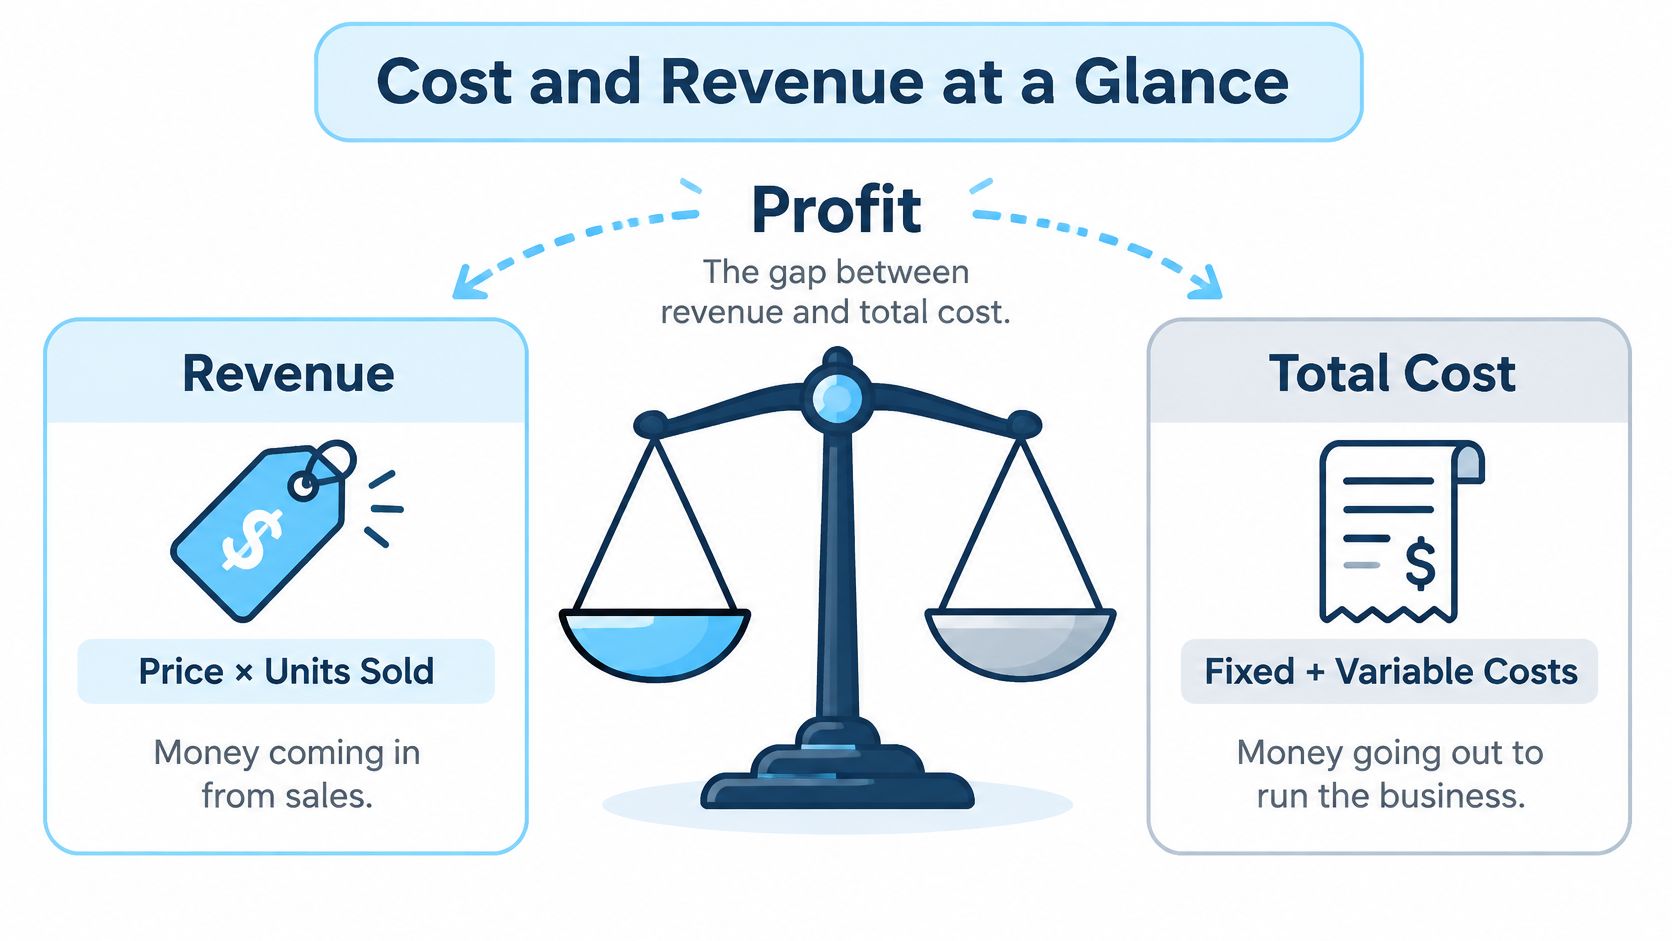
Every business decision comes down to one relationship. Revenue is what customers pay you, total cost is what it takes to serve them, and profit is the gap between the two. Widen the gap and the business works. Narrow it and the business is in trouble, no matter how busy the calendar looks.
The formula fits in three lines:
- Revenue is price multiplied by units sold.
- Total cost is fixed costs plus variable costs.
- Profit is revenue minus total cost.
Every other measure in business finance, from gross margin to customer lifetime value, is one of those three lines rearranged.
| Term | Formula | What it tells you |
|---|---|---|
| Revenue | Price times units sold | Money coming in from sales |
| Total cost | Fixed costs plus variable costs | Money going out to run the business |
| Profit | Revenue minus total cost | What remains after every cost is paid |
| Gross margin | (Revenue minus variable costs) divided by revenue | Share of each sale kept after direct costs |
| Break-even point | Fixed costs divided by (price minus variable cost per unit) | Units needed before profit becomes positive |
Profit is the distance between the two sides of that scale, and it shifts every time either side moves.
A bakery makes the arithmetic visible. Sell 200 loaves at $4 and revenue is $800. Ingredients and packaging at $1.50 a loaf come to $300, rent is $200, so total cost is $500 and profit is $300. Gross margin is 62.5%, the share of each sale left after the direct cost of the loaf.
Now move one number. Cut the price to $3.50 and revenue falls to $700 while costs hold, leaving $200 of profit. Leave the price alone but raise ingredient costs 20% to $1.80 a loaf and variable costs climb to $360, total cost to $560, profit to $240. Do both and $140 is left. At $4 a loaf with $1.50 of variable cost, the bakery covers its $200 of rent after 80 loaves.
Every decision about a price, a purchase or a hire widens or narrows that gap. The rest of this guide is about measuring which, before you commit.
How Fixed and Variable Costs Move With Sales
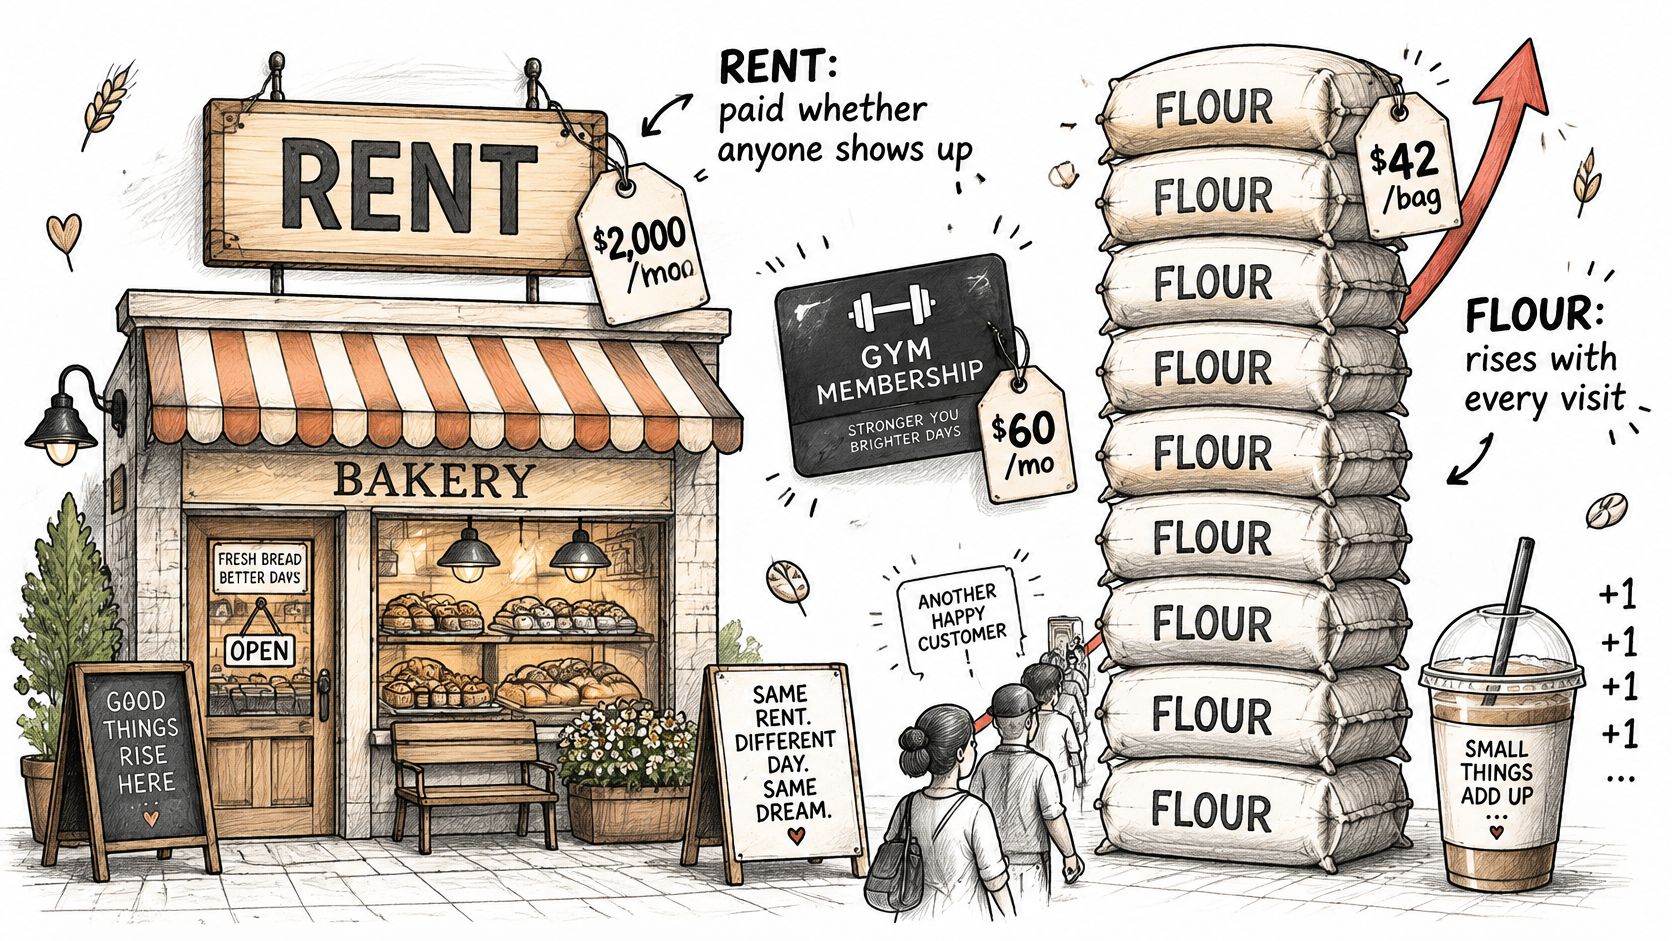
Rent behaves like a gym membership. You pay it whether or not you show up. Flour behaves like the drink you buy on the way out: skip the workout and you skip the expense.
Fixed costs hold steady regardless of how much you sell in a given period. Rent, salaried staff, insurance, software renewals and accountancy fees all arrive on schedule, whether the month was strong or dismal. Variable costs rise with each unit you sell. Materials, packaging, shipping and the percentage a card processor keeps on every transaction move in step with volume.
Run the bakery at two volumes and the difference in unit cost appears on its own. At 100 loaves, $200 of rent plus $150 of ingredients gives a total cost of $350, or $3.50 per loaf. At 400 loaves, the same $200 of rent plus $600 of ingredients gives $800, or $2.00 per loaf.
The rent didn't shrink. It spread. That's why a business can feel expensive at low volume and comfortable at high volume without a single supplier changing their price.
Where the saving stops
Cost per unit falls as volume rises only until something forces a step. An oven that handles 300 loaves a week sets a ceiling, and a second oven adds a new fixed cost that pushes unit cost back up until volume catches it again. An extra employee, a bigger storage unit, a second van: these are step costs, fixed within a range and then jumping.
You can't average a step cost across a volume you haven't reached yet. Note the sales level at which each step triggers, and treat everything below it as the current fixed base.
Label every expense once
Take your last twelve months of outgoings and put each one in a column. Do it once, thoroughly, and every later calculation gets faster.
- Fixed: rent, insurance, salaried payroll, software renewals, loan interest. These sit in the numerator of every break-even sum you'll run.
- Variable: ingredients, packaging, delivery, payment processing, hourly labour tied directly to output. These set your contribution per unit.
- Step: the second oven, the extra van, the contractor you take on above a certain volume. These get a trigger level, not a monthly average.
The labels matter more than the amounts. A cost filed in the wrong column produces a break-even figure that looks precise and is wrong.
How Revenue Is Earned and Priced
A $30 sale at the counter and a $5 monthly plan can end up worth similar money and still arrive on completely different calendars. Price times units is the whole of the revenue formula. The billing model decides when that cash shows up, and how sure you can be it will show up again.
A shop takes the money at the till and the transaction closes. A subscription takes the money in advance, then has to earn the right to charge again at every renewal. Cash already collected is not the same as cash you hope a customer will send next quarter. That gap is what you can safely spend against.
| Model | When cash arrives | Predictability | Main risk |
|---|---|---|---|
| One-time sale | At purchase | Low after the first sale | Must keep finding new buyers |
| Subscription | Monthly or yearly, in advance | High while renewals hold | Early cancellation |
| Usage-based billing | As customers use the product | Set by that period's usage | Revenue tracks volume, not commitment |
| Freemium with paid upgrades | After free users convert | Low to medium | Only a share of users pay |
| Advertising | Per impression or click | Set by that period's traffic | Depends on audience scale |
Ask one question before you pick a column: does the billing model match how often your customers come back?
Apple's fiscal 2025 results filed with the SEC report total net sales of $416.161 billion, of which Services reached $109.158 billion, about 26.2% of the total, up from roughly 24.6% in 2024 and 22.2% in 2023, with Services up about 13.5% year over year while total sales grew about 6.4%. The recurring slice is growing faster than total sales.
Tintd, available on the Mac App Store, uses two of those rows. A buyer can make a one-time in-app purchase for a single feature or item, or start an auto-renewing membership billed in advance, monthly or yearly. The number on the price tag is only the visible part. Tintd can change a subscription price at its own discretion, with reasonable advance notice, and the new price takes effect at the end of the current billing period. If the user does not expressly accept that price before the renewal date, the subscription does not renew and is cancelled. Fees already paid are non-refundable unless the law requires otherwise, and a valid payment method, such as a bank card, is required to pay.
Compare models on what a customer is worth over time, not on the sticker. A $30 one-time sale from someone who buys once is worth $30. A $5 monthly plan from someone who stays 14 months is worth $70, and worth $15 if they leave after three. The difference is the cost of finding the next buyer, or of losing a renewal you had already counted on.
How to Find Your Break-Even Point
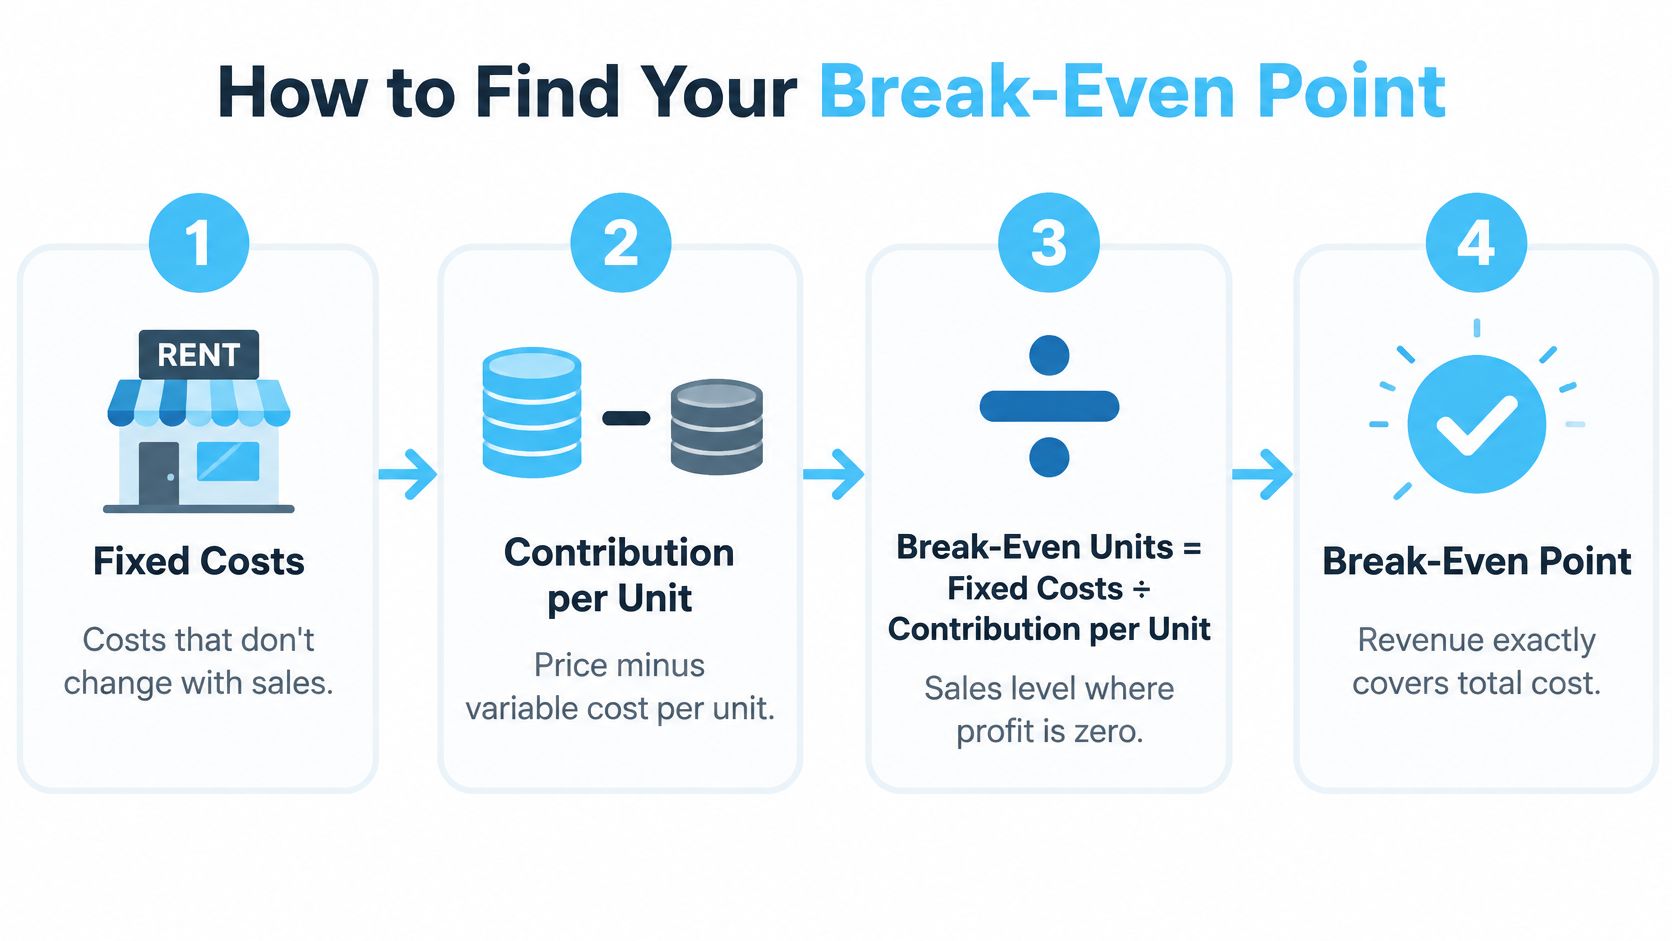
A card maker prices each card at $25 and still wonders why the month feels tight. Rent, insurance, and the booth fee do not shrink when a slow Saturday sells only a few cards. Break-even is the sales level where revenue exactly covers total cost, so profit is zero. Below that line the business is paying to stay open. Above it, each extra unit adds profit. That is why the number belongs in the plan before a target is set, not after the target is missed.
The formula has two halves. First comes contribution per unit: price minus variable cost per unit. Contribution works like a coin dropped into a jar. The jar has to fill the fixed-cost bill before any coin becomes profit.
Break-even units = fixed costs ÷ contribution per unit
Six steps take a pile of receipts to that single number.
- Total your fixed costs for one period. A month or a year, whichever matches how you plan.
- Write down your price per unit. The amount a customer pays, after discounts and refunds.
- Write down your variable cost per unit. Include payment processing, because it scales with every sale.
- Subtract to get contribution per unit. This is the money each sale hands toward fixed costs.
- Divide fixed costs by contribution per unit. That result is break-even in units.
- Compare with realistic sales. Use last year's figures or a deliberately cautious estimate, never the number you hope to hit.
The same formula travels across very different businesses. Only the fixed costs and the period change.
| Scenario | Price per unit | Variable cost per unit | Break-even units |
|---|---|---|---|
| Handmade card shop ($1,500 fixed) | 25 | 10 | 100 |
| One-time software license ($12,000 fixed) | 40 | 15 | 480 |
| Annual subscription ($4,800 fixed) | 60 | 12 | 100 |
| Consulting day rate ($9,000 fixed) | 1,100 | 200 | 10 |
A perpetual license and a subscription are compared on the units each needs to clear its own costs. On the buyer's side, set the one-time price against 12, 24, and 36 months of subscription totals. Which option costs less depends on how long the product stays in use. Renewals are the weak point of that projection. Subscriptions often thin out as people cancel, pause, or forget to stay, so a forecast that assumes every buyer remains enrolled for years will overstate how many units clear the fixed costs.
The sticker price is only the visible part of this math. Hours spent learning a tool, the friction of switching later, the risk of a bad fit, and the cost of being locked in never appear in price minus variable cost. Leave them out and the break-even you just calculated is a cash floor, not the full decision.
Price changes move the target more than a small discount suggests. Take the license above and cut the price 10%, from $40 to $36. Contribution drops from $25 to $21, so $12,000 ÷ $21 comes to about 571 units, up from 480. A 10% discount demands roughly 19% more sales just to hold profit at zero.
Margin of safety is the cushion left after break-even: expected units minus break-even units, divided by expected units. Expect 700 licenses against a 480 break-even and (700 minus 480) ÷ 700 gives about 31%. Sales can fall nearly a third before profit disappears.
If you want a second walkthrough of the same calculation with different examples, Grow My Acorn's break-even guide covers the analysis step by step.
Hidden Costs That Change the Math
A $5 sticker and a $60 sticker look easy to rank until you price the hours around them. The label is only the part a comparison table can see. Time, switching, lock-in and risk sit underneath, and any one of them can flip which option pays off.
Start with time, the hidden cost that converts most cleanly into money. Two hours a month spent renaming and sorting folders, at a $40 billable rate, is $80 of work you could have sold. A folder tool that removes that chore should be judged against the $80, not against a rival priced at $5. It works like a slow drip: each hour is small, and the month is not.
Switching costs arrive on the way in. Exporting old setups, rebuilding saved views, teaching the new steps, and fixing the mistakes of the first week all have an hour count. Add those hours at the same rate before you call a cheaper tool a saving.
Lock-in costs arrive on the way out. If ending a subscription also ends access to the files or workflows built inside it, that exit price belongs in the first comparison, not in a surprise later.
Risk has a price even in a quiet month. IBM's 2025 breach research puts the global average cost of a breach at $4.44 million, and finds that incidents lasting more than 200 days cost about $5.01 million against $3.87 million for shorter ones. Those figures average organisations of every size, so read them as a scale check, not as the bill for one laptop.
Put every hidden cost in the same units as the price. Recovering two hours a month at $40 is $80. A $60 one-time tool that does that job covers its sticker in less than a month of recovered time, and the $80 stays with you after that. Local processing can be worth paying for even when it creates no new sales, because it shrinks exposure. Tintd applies icons and colors to folders entirely on the device, so folder names and metadata never leave the machine.
Money leaving the account needs the same habit as money coming in. Snyp on tracking receipts and expenses shows how a receipt and expense log keeps small outflows from slipping past the model.
Misconceptions That Distort Profit Decisions
Four beliefs cause most of the bad calls. Each is easy to hold and cheap to correct.
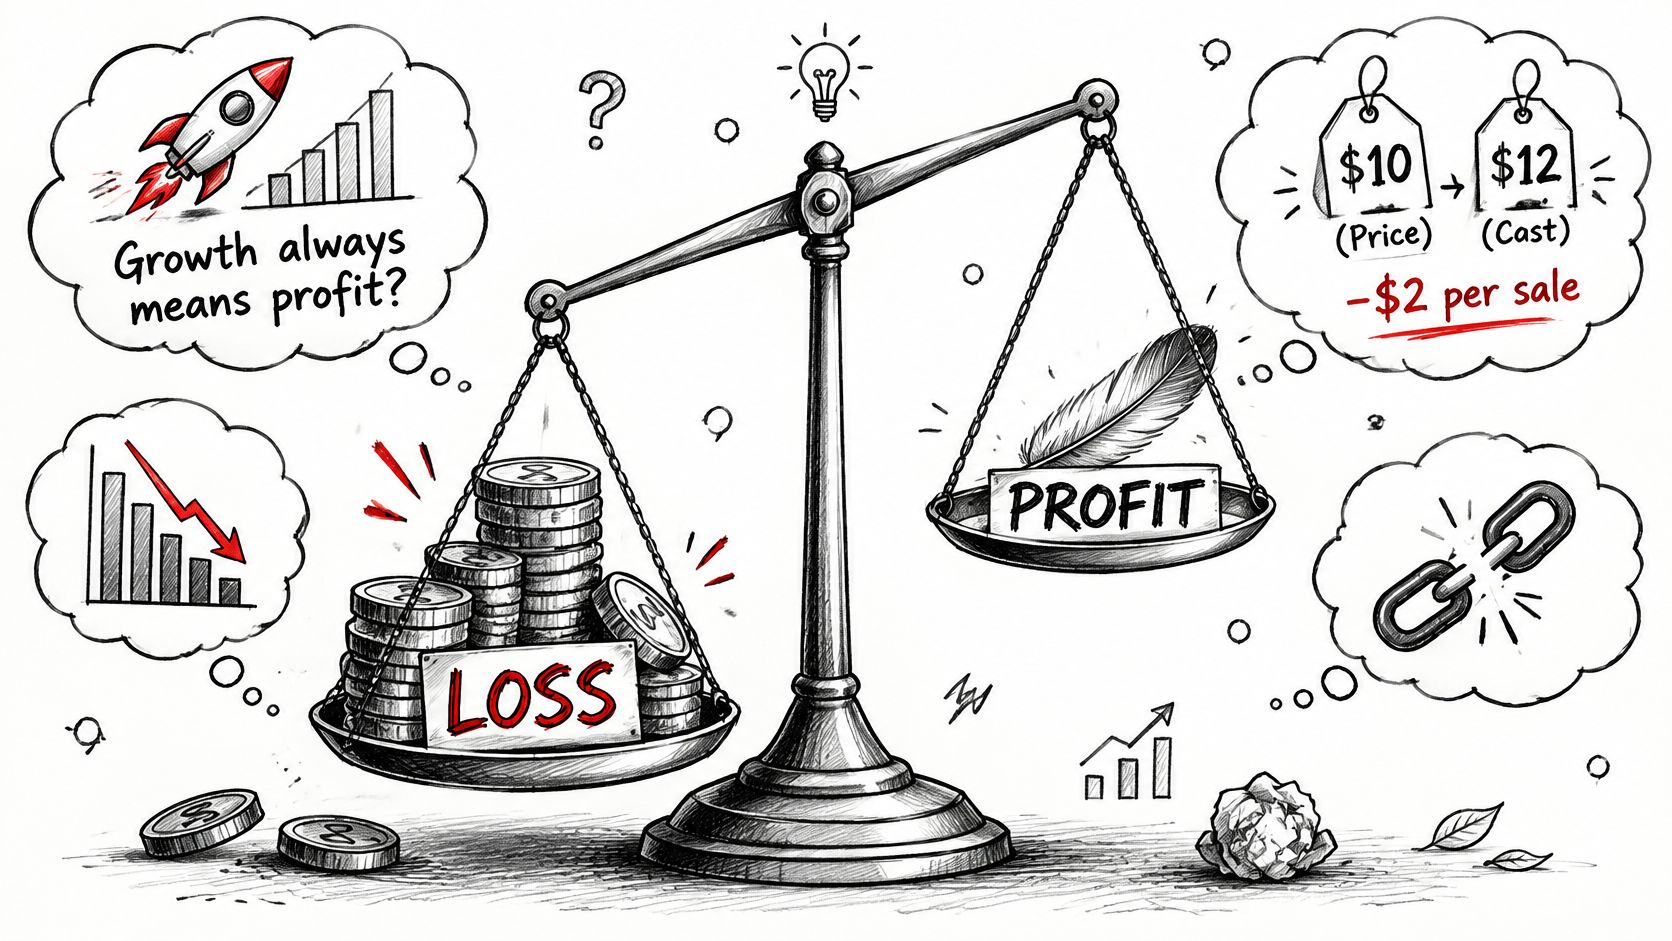
Growth always means profit. If the price is $10 and the variable cost is $12, every extra sale loses $2, and doubling sales doubles the loss. Check contribution per unit before you chase volume.
The cheapest option is cheapest overall. A supplier who undercuts the next quote by a slim margin and delivers a week late can erase the saving in rework, refunds and customers who don't return. Check the cost of a failed delivery, not the invoice.
A higher price always improves profit. Raise a $10 product to $12 and you gain $2 a sale, but if a third of your customers leave, 100 sales become 67 and revenue falls from $1,000 to $804 against unchanged fixed costs. Check how much volume the new price costs you before banking the gain.
The monthly price is the actual price. Run the same purchase across three horizons.
- 12 months: a $5 monthly plan and a $60 one-time license cost exactly the same.
- 24 months: the subscription has taken $120, and the license is still $60.
- 36 months: $180 against $60, with nothing extra delivered for the difference.
A leaking bucket doesn't fill faster because you pour harder. Find the hole before you buy a bigger jug.
Confirm Your Numbers Before You Commit
A spreadsheet is only useful if its assumptions hold up in an ordinary month. Use these six checks before you commit:
- Include every fixed cost, including annual bills. Insurance, software renewals, and accountancy fees may arrive once a year. Divide each by the period you are modelling so it appears in the right total.
- Use realistic volume. Start with last year's figures or a cautious estimate. Keep an optimistic case separate, so a best-case forecast does not stand in for your expected result.
- Compare equal time periods. A one-time price and a monthly fee are difficult to compare at a glance. Calculate both across 12, 24, and 36 months.
- Read the current pricing, cancellation, and refund terms. Paid subscription fees are non-refundable unless the law requires otherwise. Subscription prices can change at the provider's discretion, with changes taking effect at the end of the current billing period. Include that possibility in your decision before paying.
- Check the cushion. If you expect 1,000 sales and break even at 950, a 5% shortfall erases the profit. A narrow margin can disappear in a routine slow month.
- Review the numbers regularly. Update the model when costs or sales volume change, and keep it short enough to revisit.
The decision rule is simple: if revenue still exceeds total cost under cautious assumptions, the choice has support. If it only works with optimistic sales, wait or reduce the commitment until the numbers hold up.
Tintd helps Mac users style Finder folders with custom icons and colors, applied manually, in batches, or automatically when new folders appear. Its suggestions are processed on-device. Visit Tintd to see whether its purchase and subscription options fit your workflow.